Menu
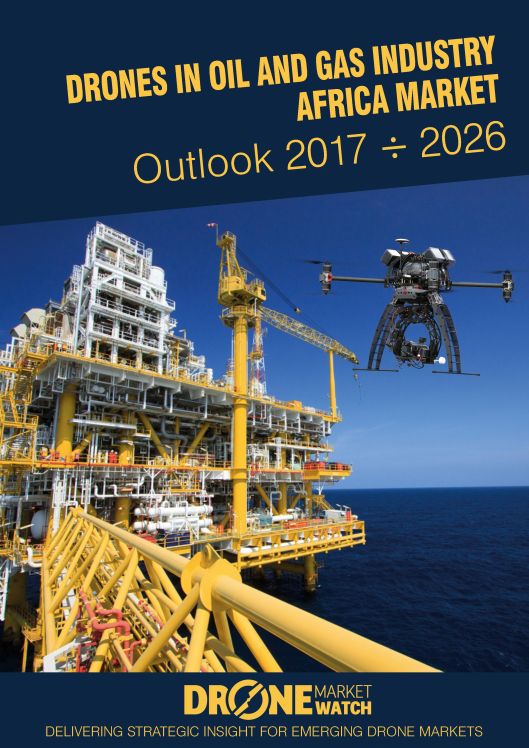
Drones in Oil and Gas Industry Africa Market Outlook 2017 - 2026.jpg

Drones in Oil and Gas Industry Africa Market Outlook 2017÷2026 - Single User

Product Variations
Base price for variant: 2450,00 €
Discount:
Sales price: 2450,00 €

With shipment by Email for 0,00 €

Description

Unique market report provides an incisive and reliable overview of drones (UAVs) in oil and gas industry in Africa for the period 2017 ÷ 2026...

Update: 1Q 2018
Format: 1 file(s) (PDF report) in English language
Author: Drone Market WatchTM
Pages: 132
Report production №:
DMWIN38920171288
Delivery:
24 - 48 hours by e-mail with 100% Money Back Guarantee

  • This first ever made unique and independent, 130+ page report of Drone Market Watch™ analyzes Africa market for drones (UAVs) application in oil and gas industry regarding market dynamics, technology characteristics, industry structure, innovations and key industry vendors. Through extensive research and discussions with experts in the industry, Drone Market Watch™ has identified a series of market trends that will impact this market over the coming decade.
    Falling oil prices in the beginning 2016 to their lowest level since 2003 led to high pressure to the global oil and gas industry for emergent cost reduction wherever possible. Oil and gas pipelines with more than 3.9 million km total length worldwide are subject to physical wear out and need regular inspections throughout their lifespan. Maintenance, structural inspections and surveillance activities of oil and gas rigs are costly to plan and execute, and must be done routinely to avoid leaks, production outages and unplanned shutdowns. UAVs offer an attractive cost and time saving option compared to conventional approaches to facility management in oil and gas industry. Several global oil and gas corporations have deployed drones (UAVs), and found that they demonstrated significant, measurable value, including improving industry operator safety. Drones (UAVs) can transmit live, high-definition video, left, and infrared video to inspectors on the ground, who can identify metallic components showing signs of thermal fatigue and locate sources of gas leaks at oil and gas rigs.
    Drones in Oil and Gas Industry Africa Market Outlook 2017 ÷ 2026 is essential reading for you or anyone in with an interest in the rising application and role of drones (UAVs) in oil and gas industry, explaining how this market will develop in Africa over the next ten years. Purchasing this report will aid your company’s ability to recognize important market opportunities and understand the possibilities for investment in this area. For your convenience we offer opportunity for orders with customized report content. Reasons to buy this market report are, but no limited to:
    • The potential of drones (UAVs) application in oil and gas industry in Africa by countries
    • Over 50 charts, maps, figures and tables
    • Historical market data provided from 1997 to 2016 and forecasts until 2026
    • Development scenario of the Africa drones (UAVs) market in oil and gas industry until 2026
    • Drone (UAV) unit cost and services cost in Africa oil and gas industry industry 2017
    • Regulatory flight policies at global and country level related to the use of drones (UAVs) in Africa oil and gas industry
    • Expected revenue forecast from drone (UAV) sales and related services over the next 10 years (2017 – 2026)
    • SWOT Analysis
    • Market dynamics comprising main market drivers, restraints and challenges
    • Drone (UAV) vendors active in Africa oil and gas industry inspection market (hardware manufacturers)
    • Drone (UAV) inspection services and solutions providers (hardware, optics, sensors, software)
    • Key technologies and innovations as main drivers of drones (UAVs) in oil and gas industry
    • Investment potential and opportunities

    At next pages you will see the full table of content of this report. To order this report just click on the button "ADD TO CART". Table of contents is referential and may vary upon report updates. If you have any other questions or data requests please do not hesitate to call us on ++44 203 60 80 138 or write an e-mail to orders@dronemarketwatch.com

  • FOREWORD    8
    1.    METHODOLOGY    9
    1.1.    Research Methodology    9
    1.2.    Limitations    10
    2.    EXECUTIVE SUMMARY    11
    2.1.    Introduction    11
    2.2.    Market Overview    11
    2.3.    Market Forecast Summary    12
    3.    MARKET DRIVERS    14
    3.1.    Oil and Gas Rig Inspection    19
    3.1.1.    Structural Inspection    20
    3.1.2.    Flare Stack and Flare Tip Inspection    23
    3.1.3.    Gas Emissions Monitoring    25
    3.1.4.    Internal Inspection of Bulk Oil Storage Tanks    26
    3.1.5.    Offshore Oil and Gas Rig Inspection Challenges    26
    3.1.6.    Inspection in Construction Phase of Oil and Gas Rigs    27
    3.1.7.    Emergency Inspections    27
    3.2.    Oil and Gas Pipelines Inspection    28
    3.3.    Oil Spill Detection (Response) and Pollution Prevention    31
    3.4.    Surveillance and Security of Oil and Gas Rigs and Pipelines    33
    3.5.    Global Oil and Gas Market Development. Current State and Development Perspectives to 2026    33
    3.6.    DRONE (UAV) FLIGHT REGULATORY FRAMEWORK OVERVIEW IN AFRICA    46
    3.6.1.    ICAO REGULATIONS    46
    3.6.2.    AFRICA    50
    3.6.2.1.    Morocco    50
    3.6.2.2.    South Africa    51
    4.    MARKET ANALYSIS, TRENDS AND FORECASTS    54
    4.1.    Drone (UAV) Unit Cost in Oil and Gas Industry in Africa    54
    4.1.1.    Drone (UAV) Unit Cost for Oil and Gas Rig Inspection in Africa    54
    4.1.2.    Drone (UAV) Unit Cost for Oil and Gas Pipelines Inspection in Africa    55
    4.1.3.    Drone (UAV) Unit Cost for Oil Spill Detection (Response) and Pollution Prevention in Africa    55
    4.1.4.    Drone (UAV) Unit Cost for Surveillance and Security of Oil and Gas Rigs and Pipelines in Africa    56
    4.2.    Drone (UAV) Services Cost in Oil and Gas Industry in Africa    56
    4.2.1.    Drone (UAV) Services Cost for Oil and Gas Rig Inspection in Africa    56
    4.2.2.    Drone (UAV) Services Cost for Oil and Gas Pipelines Inspection in Africa    57
    4.2.3.    Drone (UAV) Services Cost for Oil Spill Detection (Response) and Pollution Prevention in Africa    57
    4.2.4.    Drone (UAV) Services Cost for Surveillance and Security of Oil and Gas Rigs and Pipelines in Africa    58
    4.3.    Annual Oil and Gas Rigs and Pipelines Inspected by Drones (UAVs) in Africa    58
    4.4.    Revenue of Drones (UAVs) in Oil and Gas Industry in Africa    60
    4.4.1.    Cumulative Revenue of Drones (UAVs) in Oil and Gas Industry by Segment in Africa    61
    4.4.1.1.    Oil and Gas Rig Inspection    61
    4.4.1.2.    Oil and Gas Pipelines Inspection    62
    4.4.1.3.    Oil Spill Detection (Response) and Pollution Prevention    63
    4.4.1.4.    Surveillance and Security of Oil and Gas Rigs and Pipelines    64
    4.4.2.    Annual Revenue of Drones (UAVs) in Oil and Gas Industry by Segment in Africa    65
    4.4.2.1.    Oil and Gas Rig Inspection    66
    4.4.2.2.    Oil and Gas Pipelines Inspection    67
    4.4.2.3.    Oil Spill Detection (Response) and Pollution Prevention    68
    4.4.2.4.    Surveillance and security of Oil and Gas Rigs and Pipelines    69
    5.    VALUE CHAIN ANALYSIS OF DRONES (UAVs) IN OIL AND GAS INDUSTRY    71
    5.1.    Key Value Chain Elements    71
    5.2.    Potential Applications of Drones (UAVs) along the Value Chain    72
    6.    DRONE (UAV) TECHNOLOGY OVERVIEW    73
    6.1.    Brief Drone (UAV) Technology Overview    73
    6.2.    Comprehensive Configuration of Drone (UAV) for Inspection of Oil and Gas Rigs and Other Associated Services    73
    6.3.    Drone (UAV) Guidance, Navigation and Control Systems    75
    6.4.    Photogrammetry and LiDAR    75
    6.5.    Data Transmission and Data Acquisition    76
    6.6.    Payload (Sensors and Optics) Selection for Inspection of Oil and Gas Rigs and Pipelines    76
    6.7.    Constraints for Use of Drones (UAVs) for Inspection in Oil and Gas Industry    77
    7.    KEY INDUSTRY VENDORS COMPETITIVE LANDSCAPE    80
    7.1.    Drone (UAV) Vendors Active in Oil and Gas Market    80
    7.2.    Drone (UAV) Inspection and Associated Services Providers    85
    7.3.    Other Providers of Drone (UAV) Services Related to Oil and Gas Industry    90
    8.    KEY INNOVATIONS    94
    8.1.    Ultra-Light LiDAR systems for drone (UAV) applications    94
    8.2.    Counter-Drone (Anti-Drone) Systems about Inspection Drones (UAVs) Flying In Protected/Restricted Areas (No Fly Zones)    97
    8.3.    Top Drone (UAV) Startups and Funding    98
    9.    DRONE (UAV) INTEGRATION WITH INTERNET OF THINGS (IOT) AND SMART CITIES    101
    9.1.    Drone (UAV) in Oil and Gas Industry and Integration with Internet of Things (IOT)    101
    9.2.    Drone (UAV) in Oil and Gas Industry and Integration with Smart Cities    103
    10.    SWOT ANALYSIS OF DRONES (UAVs) IN OIL AND GAS INDUSTRY IN AFRICA    105
    11.    RISK ANALYSIS AND RISK MITIGATION    106
    11.1.    Safety Risk and Hazard Risk    106
    11.1.1.    Phase I – Safety Hazard Identification. Definition of Safety Hazards    108
    11.1.2.    Phase II – Drone (UAV)   Safety Risk Assessment    109
    11.1.3.    Phase III – Drone (UAV) Safety Risk Mitigation    112
    11.1.4.    Phase IV – Drone (UAV) Safety Documentation & Management    113
    11.2.    Regulatory Risk    114
    11.3.    Social Risk    115
    11.4.    Hacker’s (Cyber) Attacks and Theft of Drones (UAVs)    115
    11.5.    Insurance protection    117
    12.    CONCLUSIONS    118
    13.    RECOMMENDATIONS    122
    13.1.    Recommendations for Owners and Asset Managers of Oil and Gas Rigs and Pipelines    122
    13.2.    Recommendations for Drone (UAV) Inspection Companies Targeting Oil and Gas Market    123
    14.    LIST OF ABBREVIATIONS    125
    15.    COMPANY DIRECTORY    130
    16.    REFERENCES    133
    17.    DISCLAIMER AND COPYRIGHT    136
  • MAP 1: World Lighting Flashes Map: 2016, NASA    24
    MAP 2: Europe Oil and Gas Pipelines 2017    38
    MAP 3: Asia Pacific Oil and Gas Pipelines 2017    39
    MAP 4: North America Oil and Gas Pipelines 2017    40
    MAP 5: Africa Oil and Gas Pipelines 2017    41
    MAP 6: Middle East Oil and Gas Pipelines 2017    43
    MAP 7: Restricted (No Fly) Drone (UAV) Zones in South Africa: 2017    52

    Figure 1: Aerial Drone (UAV) Structural Inspection of Offshore Oil Rig    21
    Figure 2: Aerial Drone (UAV) Structural Inspection of Onshore Oil Rig    22
    Figure 3: Drone (UAV) Thermal Image of Offshore Oil Rig    23
    Figure 4: Aerial Drone (UAV) Flare Stack Inspection of Oil Rig    25
    Figure 5: Internal Inspection of Bulk Oil Storage Tank    26
    Figure 6: Aerial Drone (UAV) Image of Detected Oil Spill    32

    Chart 1: Length of Oil and Gas Pipelines Installed and Available for Inspection by Drones (in km) in Africa: 2017 – 2026; Source: DRONE MARKET WATCH    12
    Chart 2: Bloomberg WTI Crude Oil (Nymex)     2017    34
    Chart 3: Global Oil Rig Counts by Region (Africa, Asia Pacific, Europe, North America, Latin America, Middle East): March 2016 – April 2017    35
    Chart 4: Global Oil and Gas Rig Counts: January 2016 – January 2017    37
    Chart 5: Global Annual Oil and Gas Rigs Installed and Available for Inspection by Drones (UAVs) by Country (Africa, Asia Pacific, Europe, North America, Latin America, Middle East): 2017 – 2026    59
    Chart 6: Length of Global Annual Oil and Gas Pipelines Inspected by Drones (UAVs) by Country (Africa, Asia Pacific, Europe, North America, Latin America, Middle East) in km: 2017 – 2026    59
    Chart 7: Cumulative Revenue of Drones (UAVs) in Oil and Gas Industry by Country (in Millions USD) in Africa: 2017-2026    61
    Chart 8: Cumulative Revenue for Drone (UAV) Units and Services for Oil and Gas Rig Inspection in Africa (in Millions USD): 2017-2026    62
    Chart 9: Cumulative Revenue for Drone (UAV) Units and Services for Oil and Gas Pipelines Inspection in Africa (in Millions USD): 2017-2026    63
    Chart 10: Cumulative Revenue for Drone (UAV) Units and Services for Oil Spill Detection and Pollution Prevention in Africa (in Millions USD): 2017-2026    64
    Chart 11: Cumulative Revenue for Drone (UAV) Units and Services for Surveillance and Security of Oil and Gas Rigs and Pipelines in Africa (in Millions USD): 2017-2026    65
    Chart 12: Annual Revenue of Drones (UAVs) in Oil and Gas Industry in Africa (in Millions USD): 2017-2026    66
    Chart 13: Annual Revenue for Drone (UAV) Units and Services for Oil and Gas Rig Inspection in Africa (in Millions USD): 2017-2026    67
    Chart 14: Annual Revenue for Drone (UAV) Units and Services for Oil and Gas Pipelines Inspection in Africa (in Millions USD): 2017-2026    68
    Chart 15: Annual Revenue for Drone (UAV) Units and Services for Oil Spill Detection (Response) and Pollution Prevention in Africa (in Millions USD): 2017-2026    69
    Chart 16: Annual Revenue for Drone (UAV) Units and Services for Surveillance and Security of Oil and Gas Rigs and Pipelines in Africa (in Millions USD): 2017-2026    70
    Chart 17: Value Chain of Drones (UAVs) in Oil and Gas Industry    71
    Chart 18: Drone (UAV) Investment Activity 2012 - 2016    100
    Chart 19: Drone (UAV) Safety Management Process    114

    Table 1: Top 10 Countries by Length of Oil and Gas Pipelines 2017    42
    Table 2: Top 10 Global Largest Non-associated Gas Fields    44
    Table 3: Flight classification of drone (UAV) types in Morocco    50
    Table 4: Flight classification of drone (UAV) types in South Africa    51
    Table 5: Drone (UAV) Unit Cost for Oil and Gas Rig Inspection in Africa in 2017    54
    Table 6: Drone (UAV) Unit Cost for Oil and Gas Pipelines Inspection in Africa in 2017    55
    Table 7: Drone (UAV) Unit Cost for Oil Spill Detection (Response) and Pollution Prevention in Africa in 2017    55
    Table 8: Drone (UAV) Unit Cost for Oil and Gas Rigs and Pipelines in Africa in 2017    56
    Table 9: Drone (UAV) Services Cost for Oil and Gas Rig Inspection in Africa in 2017    56
    Table 10: Drone (UAV) Services Cost for Oil and Gas Pipelines Inspection in Africa in 2017    57
    Table 11: Drone (UAV) Services Cost for Oil Spill Detection (Response) and Pollution Prevention in Africa in 2017    57
    Table 12: Drone (UAV) Services Cost for Surveillance and Security of Oil and Gas Rigs and Pipelines in Africa in 2017    58
    Table 13: Potential Applications of Drones (UAVs) in Oil and Gas Industry along the Value Chain    72
    Table 14: Recommended Sensors for Inspection in Oil and Gas Industry    77
    Table 15: Top 10 Early Stage Drone Startups    99
    Table 16: SWOT Analysis of Drones (UAVs) in Oil and Gas Industry in Africa    105
    Table 17: Phases of Drone (UAV) Safety Risk Assessment    107
    Table 18: Drone (UAV) Safety Risk Probability    109
    Table 19: Drone (UAV) Safety Risk Severity    110
    Table 20: Drone (UAV) Safety Risk Matrix I    111
    Table 21: Drone (UAV) Safety Risk Matrix II    111
    Table 22: Drone (UAV) Safety Risk Mitigation    112
  • Fields with * are mandatory.